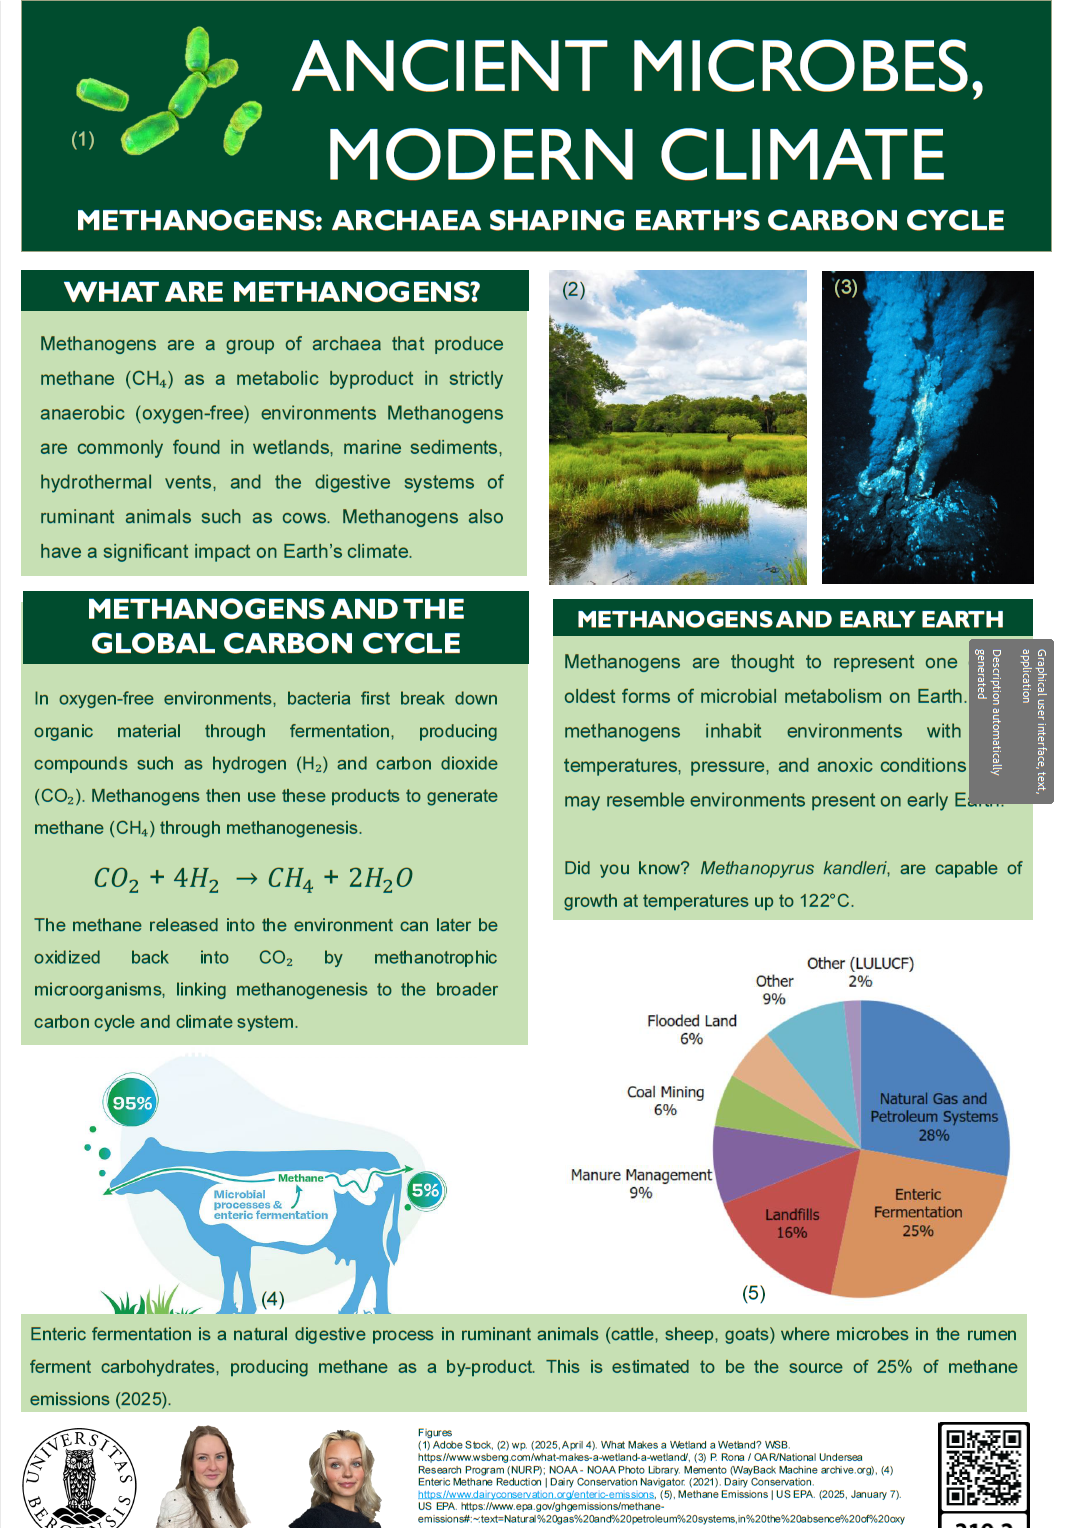
ANCIENT MICROBES, MODERN CLIMATE Posted on24/03/202616/05/2026AuthorfemjsLeave a comment Poster number: 219.2 Authors: BIO219 - Spring 2026 Download as PDF
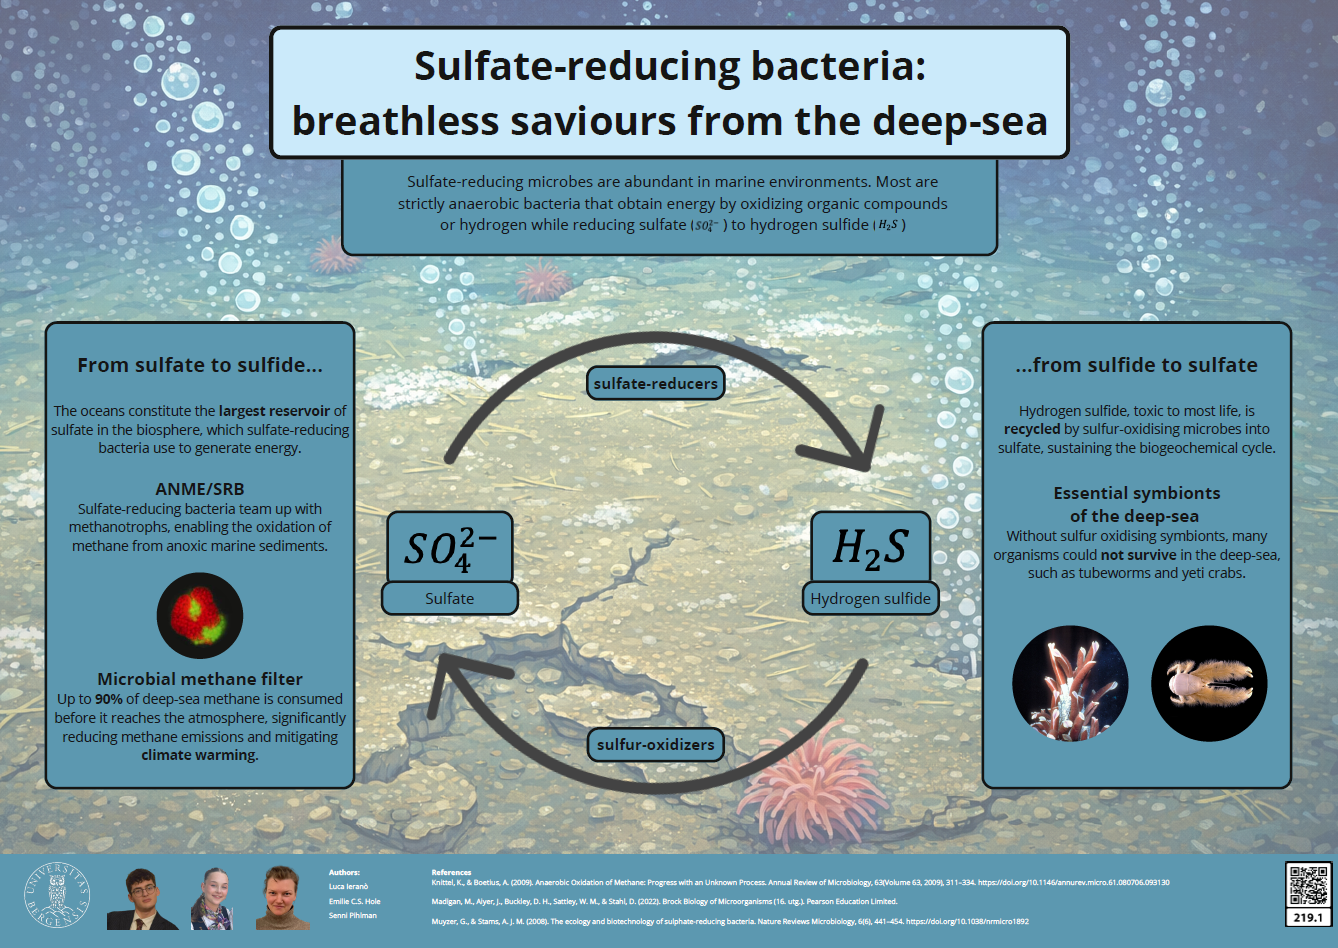
Sulfate-reducing bacteria: breathless saviours from the deep-sea Posted on24/03/202616/05/2026AuthorfemjsLeave a comment Poster number: 219.1 Authors: Luca Ieranò, Senni Pihlman & Emilie C.S. Hole BIO219 - Spring 2026 Download as PDF
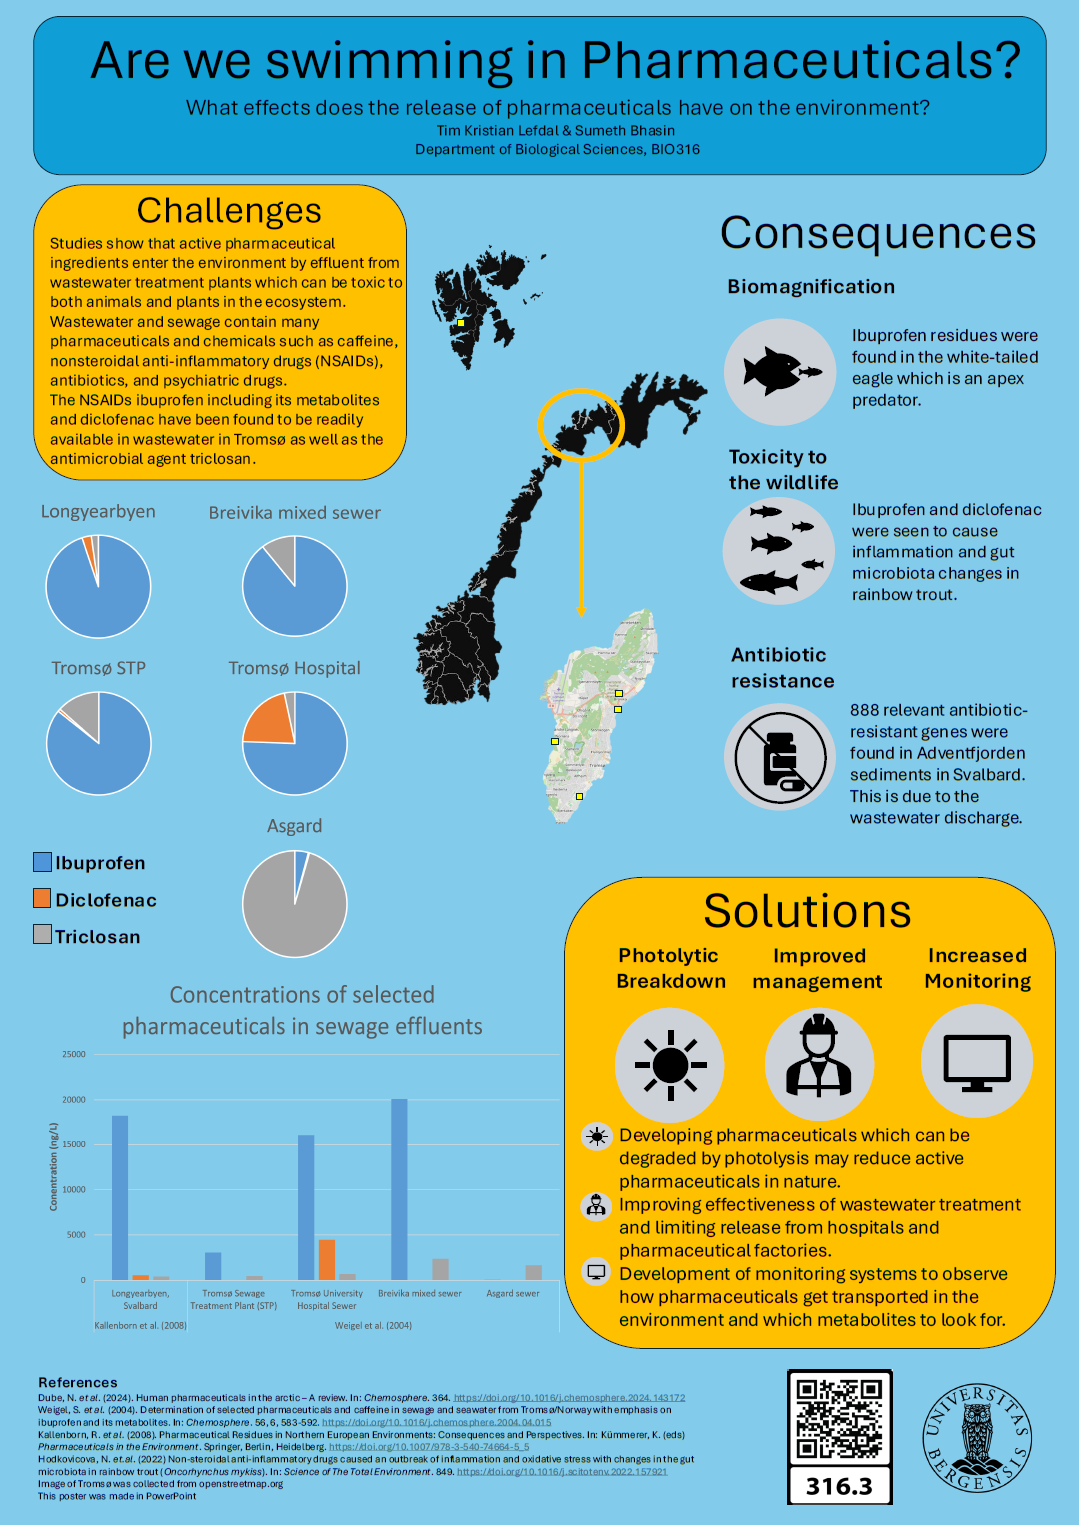
Are we swimming in Pharmaceuticals? Posted on22/03/202616/05/2026AuthorfemjsLeave a comment Poster number: 316.3 Authors: Tim Kristian Lefdal & Sumeth Bhasin BIO316 - Spring 2026 Download as PDF
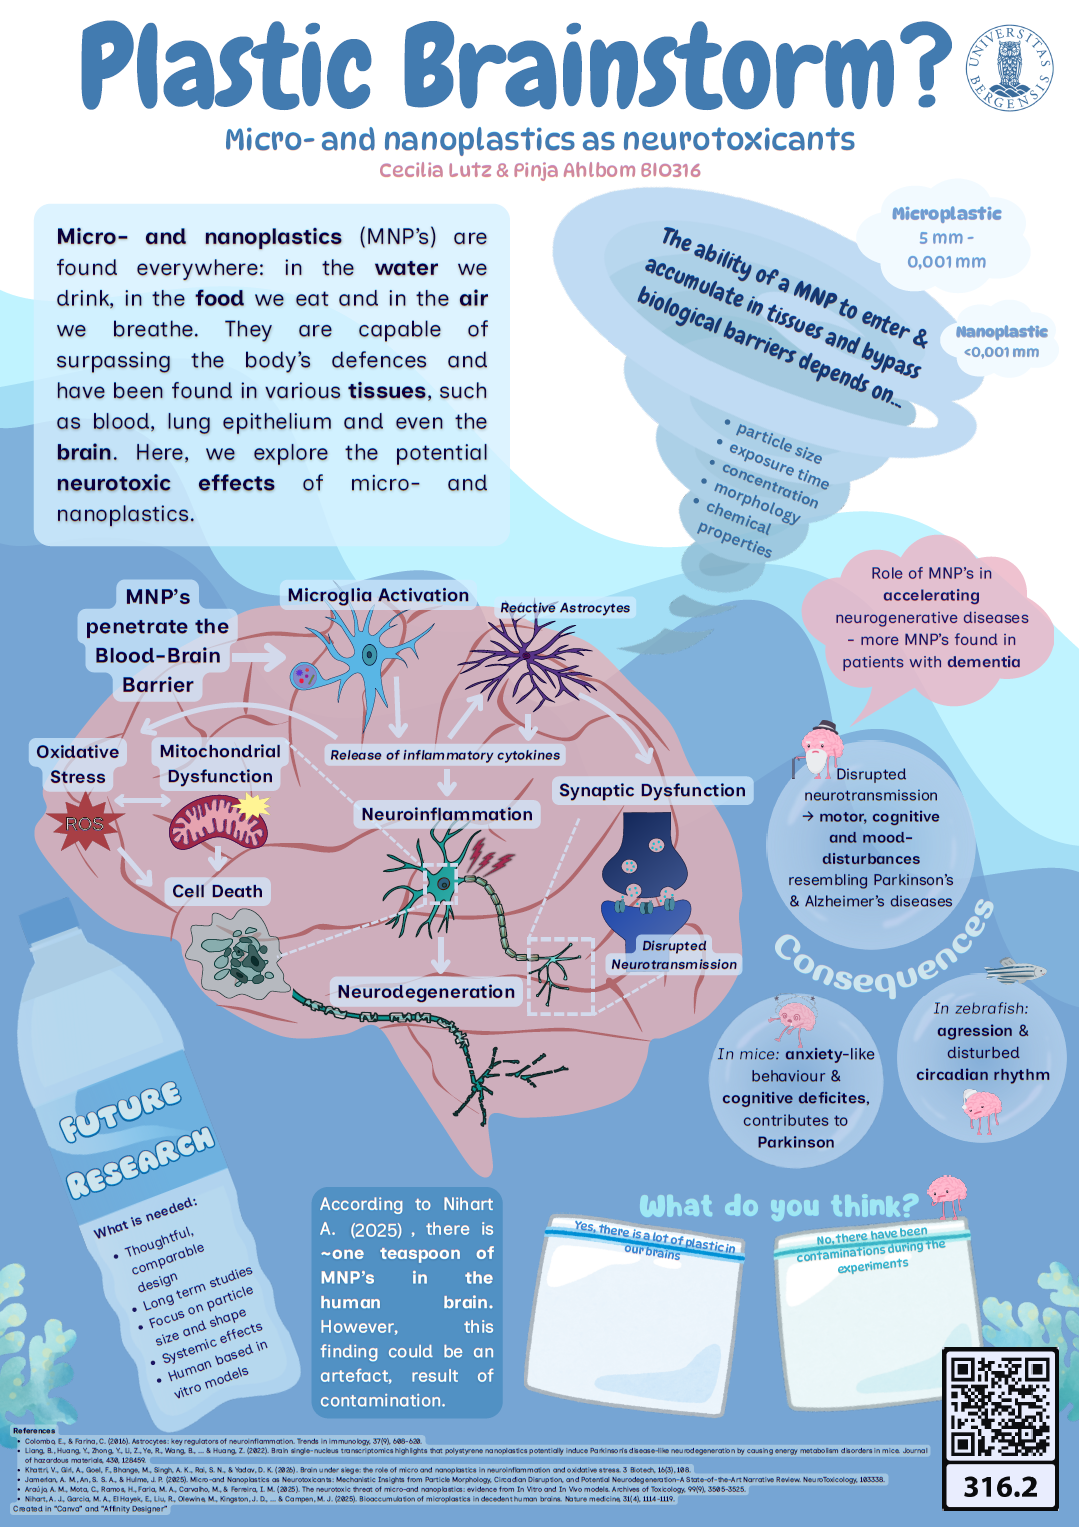
Plastic Brainstorm? Micro- and nanoplastics as neurotoxicants Posted on22/03/202616/05/2026AuthorfemjsLeave a comment Poster number: 316.2 Authors: Cecilia Lutz & Pinja Ahlbom BIO316 - Spring 2026 Download as PDF
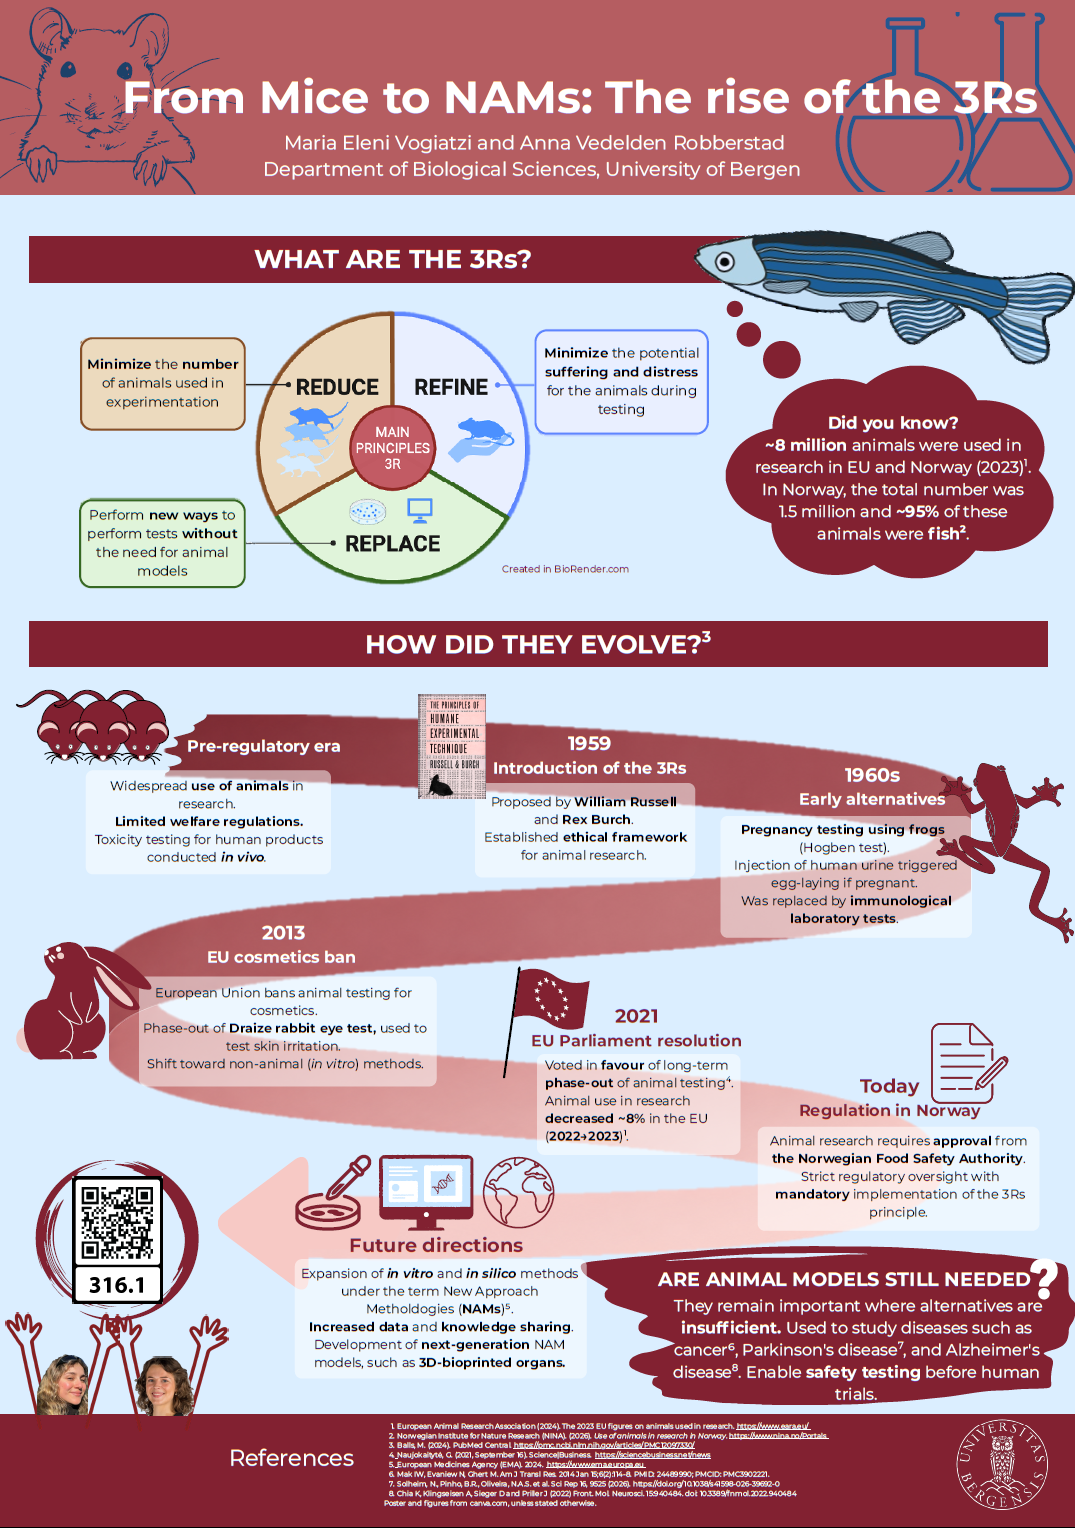
From Mice to NAMs: The rise of the 3Rs Posted on22/03/202616/05/2026AuthorfemjsLeave a comment Poster number: 316.1 Authors: Maria Eleni Vogiatzi & Anna Vedelden Robberstad BIO316 - Spring 2026 Download as PDF
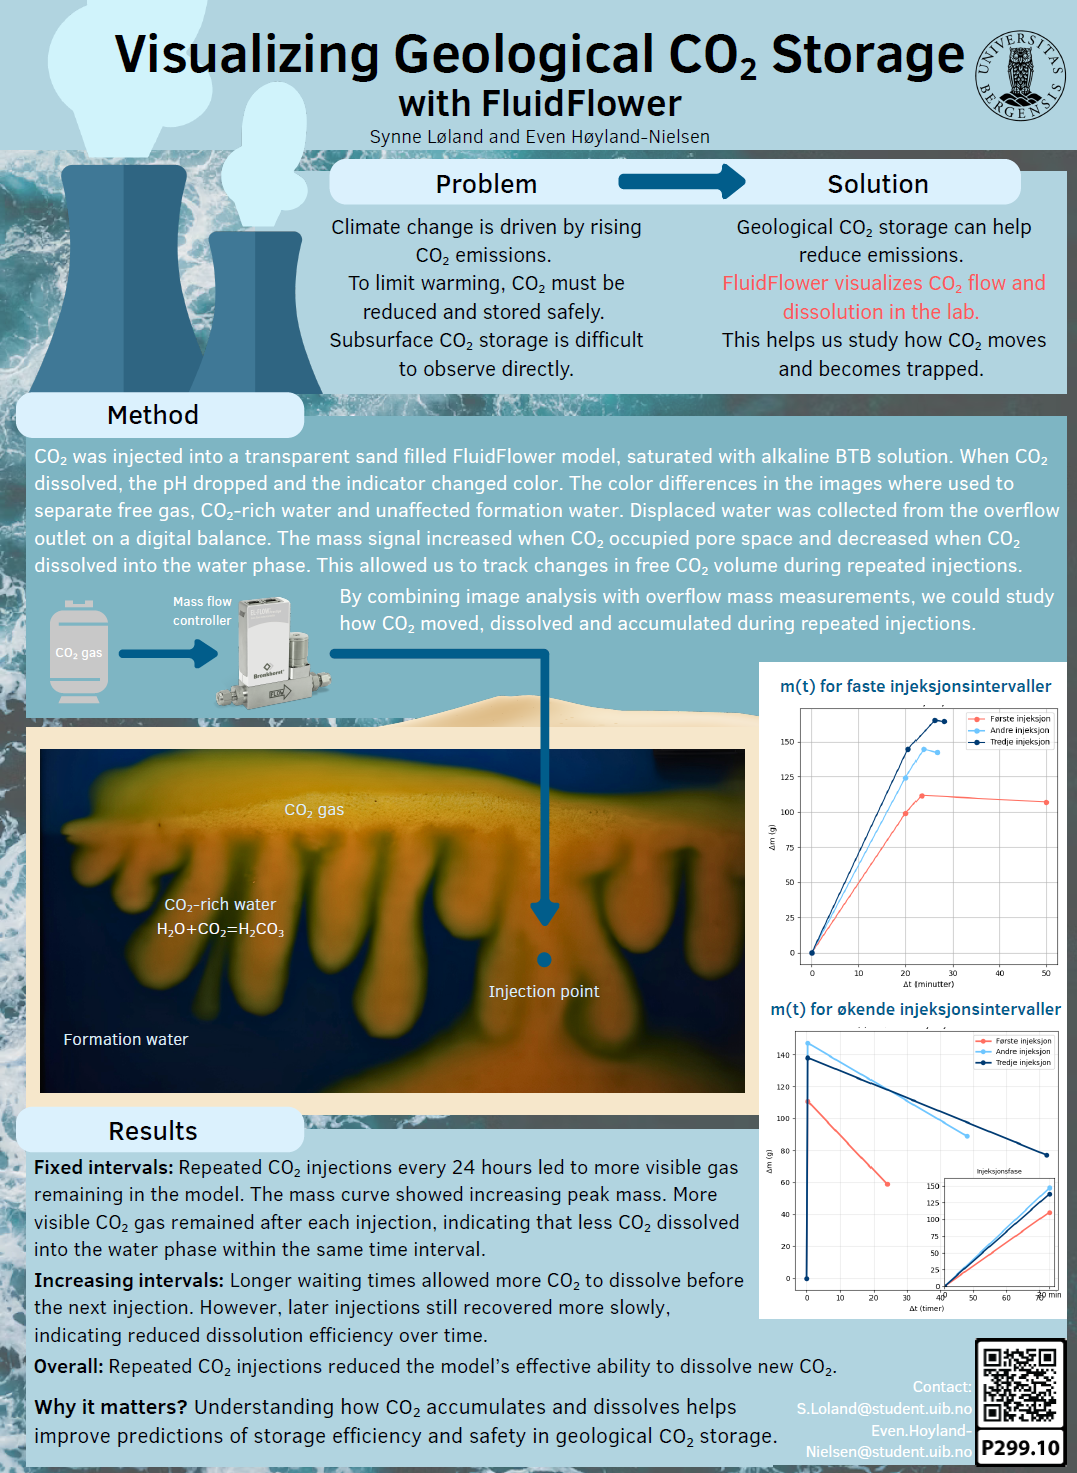
Visualizing Geological CO2 Storage with FluidFlower Posted on21/03/202616/05/2026Authorfemjs1 Comment Poster number: P299.10 Authors: Synne Løland & Even Høyland-Nielsen PHYS299 - Spring 2026 Download as PDF
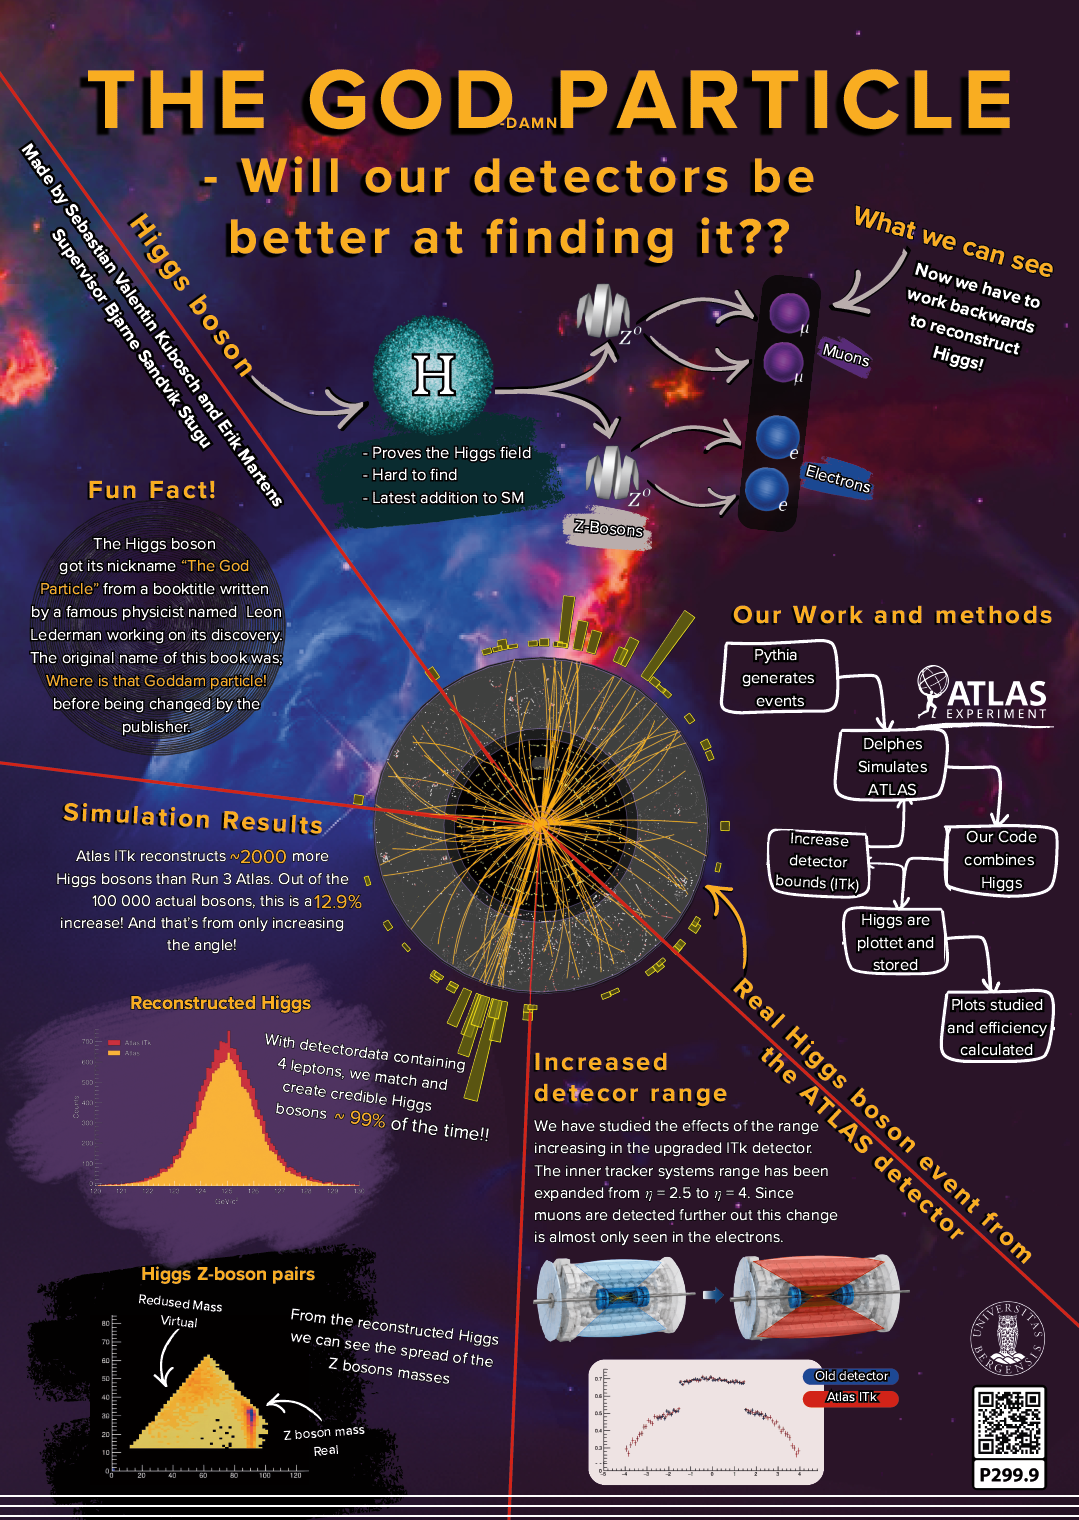
THE GOD-damn PARTICLE – Will our detectors be better at finding it?? Posted on21/03/202616/05/2026Authorfemjs2 Comments Poster number: P299.9 Authors: Sebastian Valentin Kubosch & Erik Martens PHYS299 - Spring 2026 Download as PDF
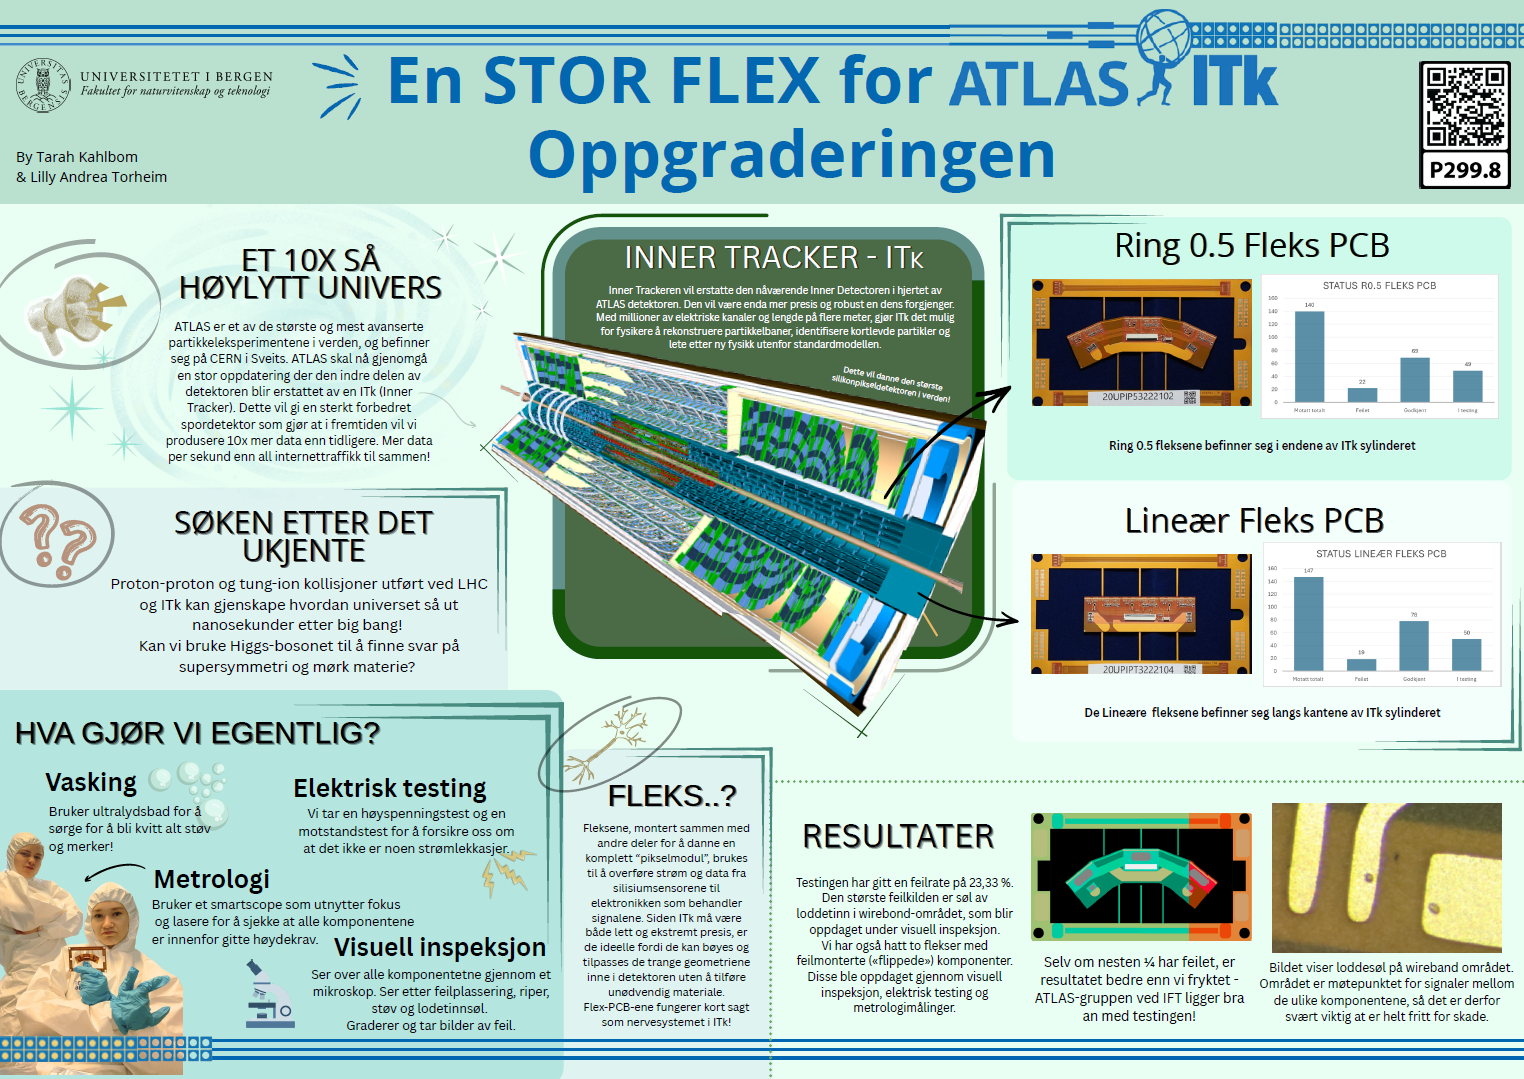
En STOR FLEX for ATLAS ITk Oppgraderingen Posted on21/03/202616/05/2026AuthorfemjsLeave a comment Poster number: P299.8 Authors: Tarah Kahlbom & Lilly Andrea Torheim PHYS299 - Spring 2026 Download as PDF
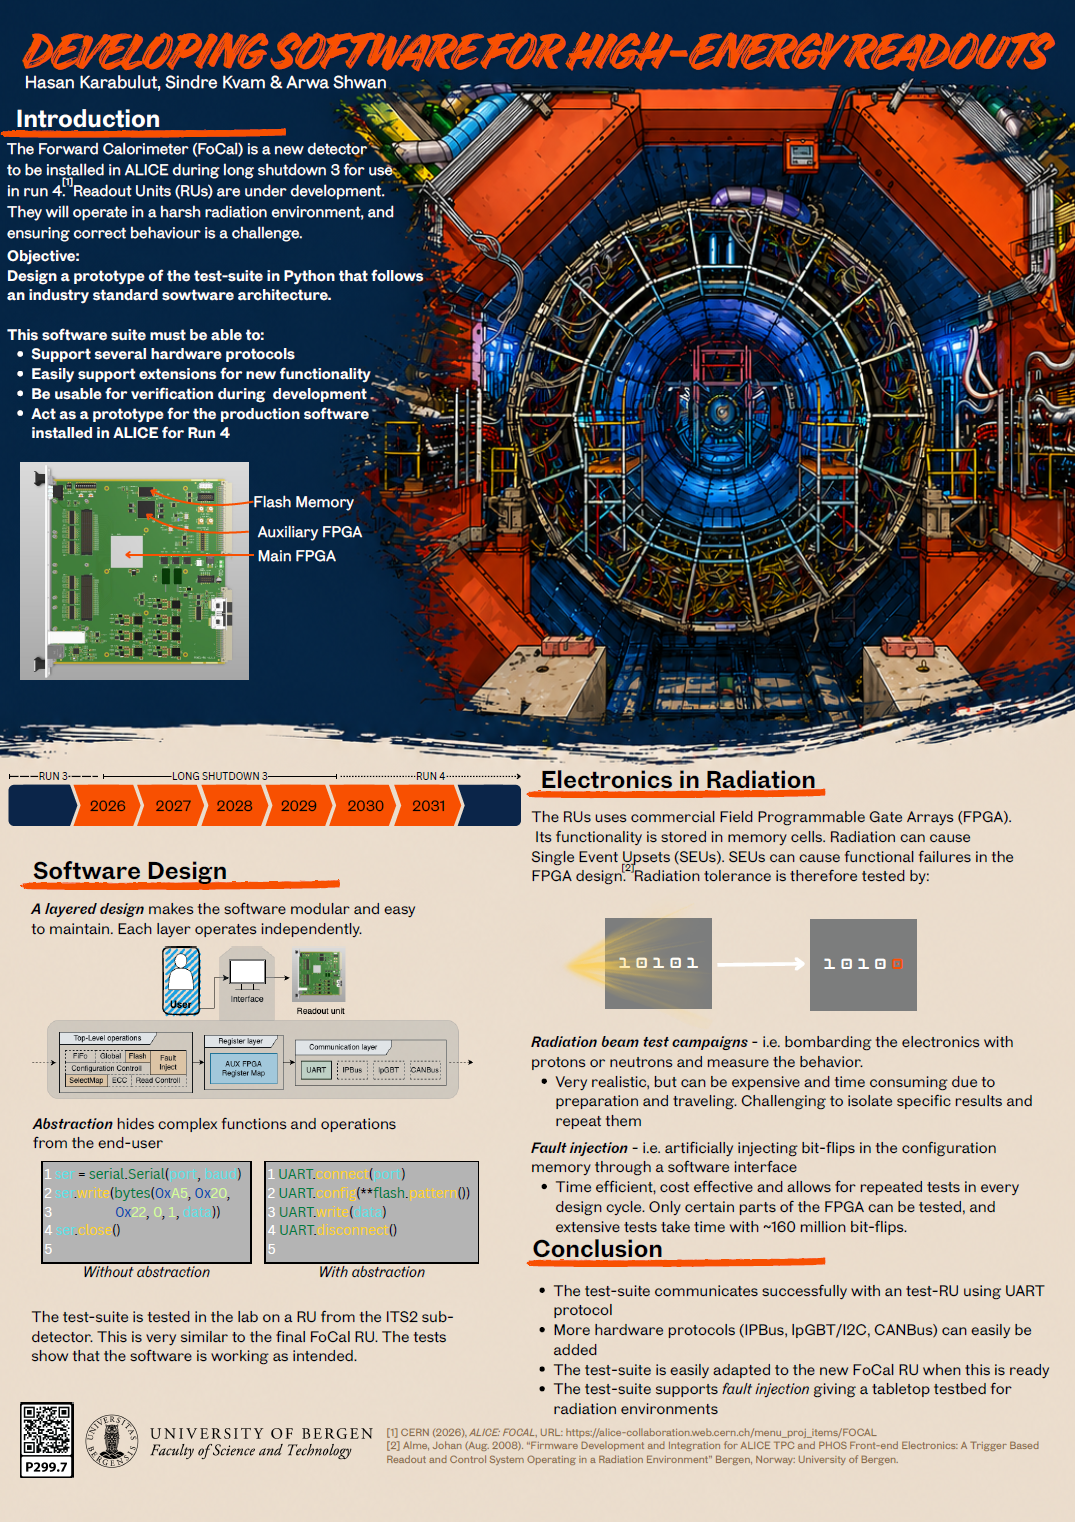
DEVELOPING SOFTWARE FOR HIGH-ENERGY READOUTS Posted on21/03/202616/05/2026AuthorfemjsLeave a comment Poster number: P299.7 Authors: Hasan Karabulut, Sindre Kvam & Arwa Shwan PHYS299 - Spring 2026 Download as PDF
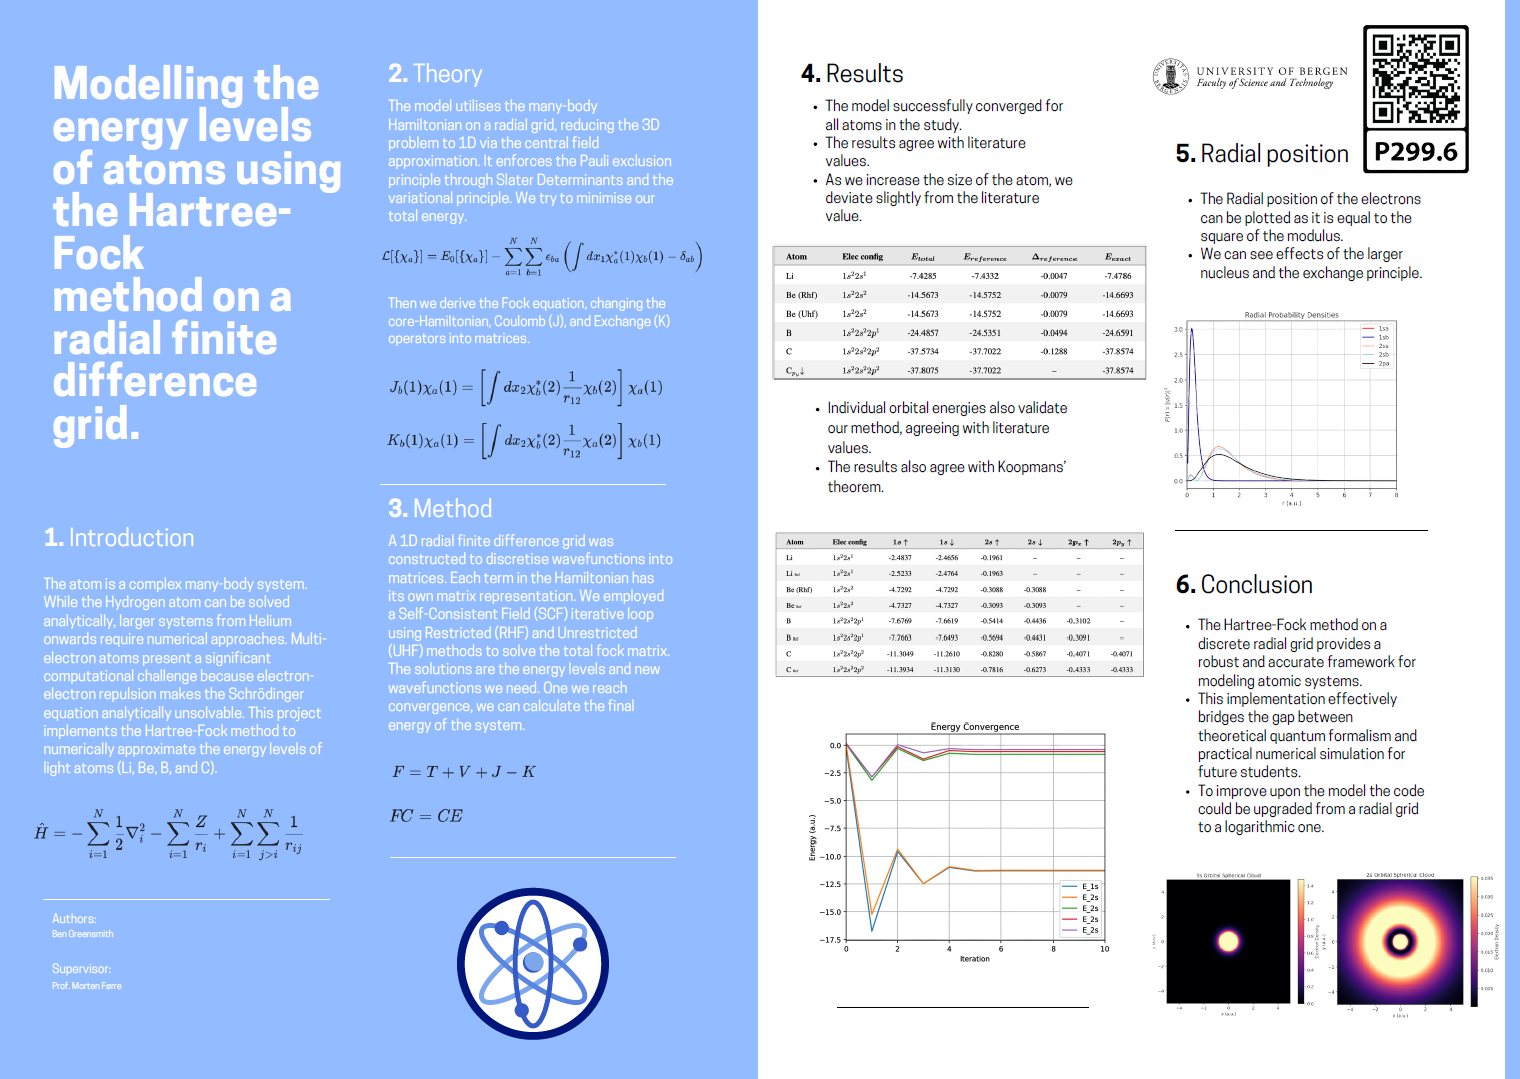
Modelling the energy levels of atoms using the Hartree- Fock method on a radial finite difference grid. Posted on21/03/202616/05/2026AuthorfemjsLeave a comment Poster number: P299.6 Authors: Ben Greensmith PHYS299 - Spring 2026 Download as PDF
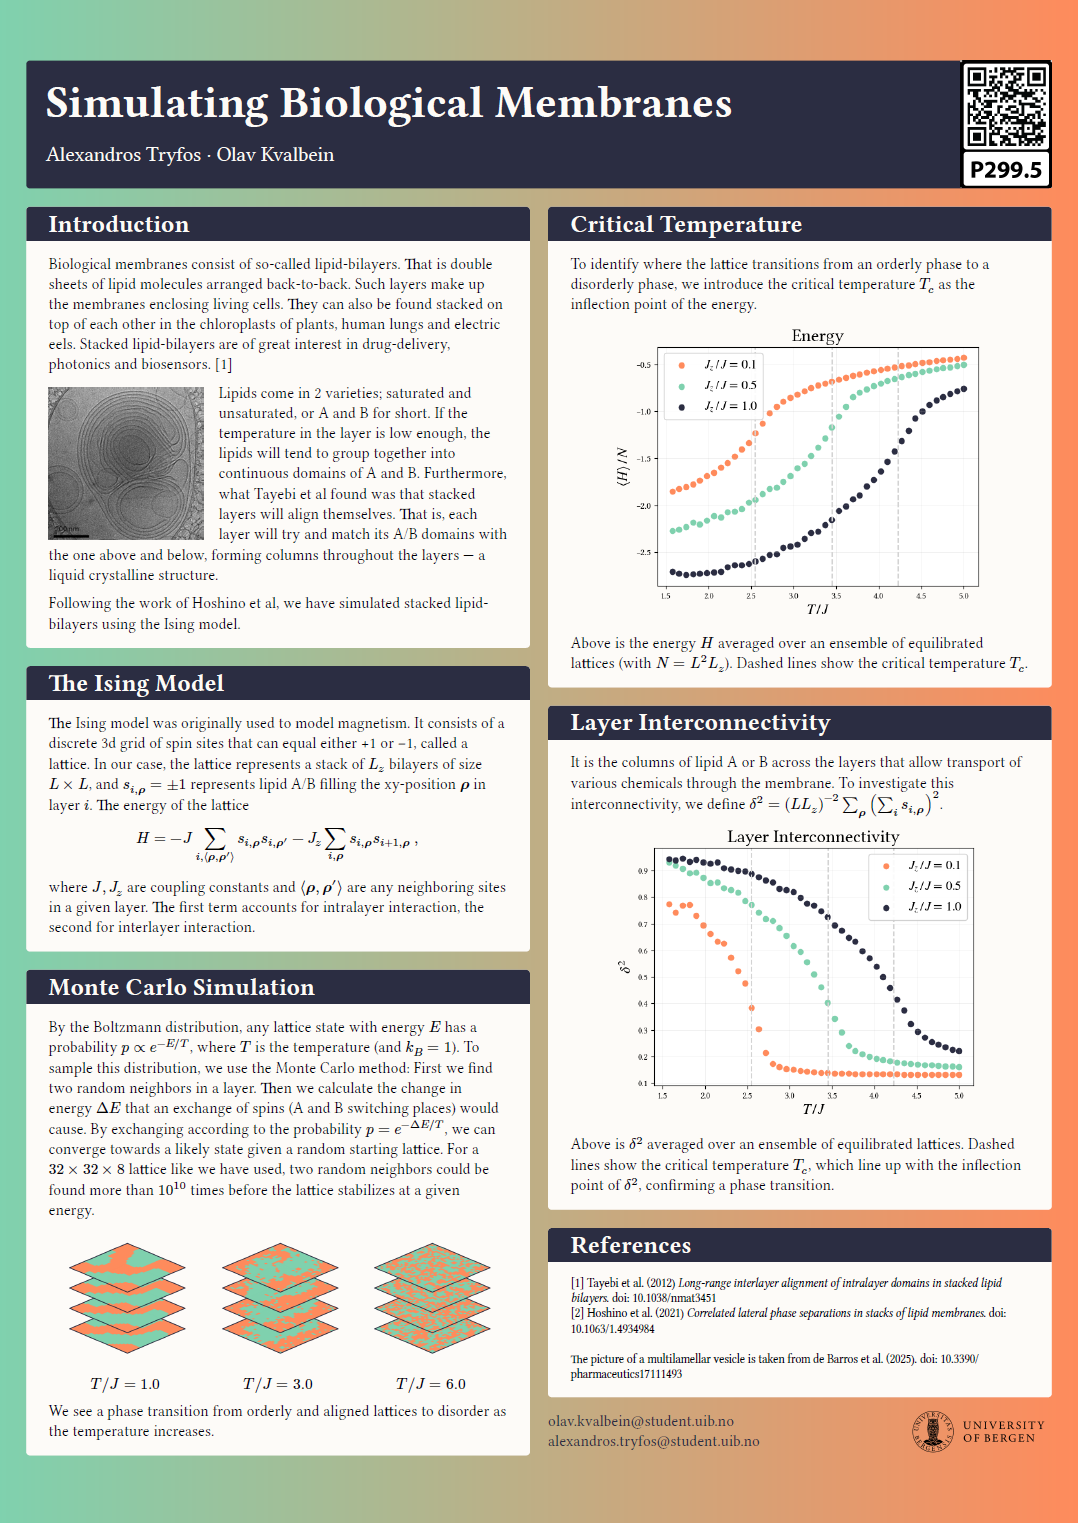
Simulating Biological Membranes Posted on21/03/202616/05/2026Authorfemjs2 Comments Poster number: P299.5 Authors: Alexandros Tryfos & Olav Kvalbein PHYS299 - Spring 2026 Download as PDF
Cleaning images with theoretical physics Posted on21/03/202616/05/2026Authorfemjs3 Comments Poster number: P299.4 Authors: Sanna Skauge & Sirawan Khongsim PHYS299 - Spring 2026 Download as PDF
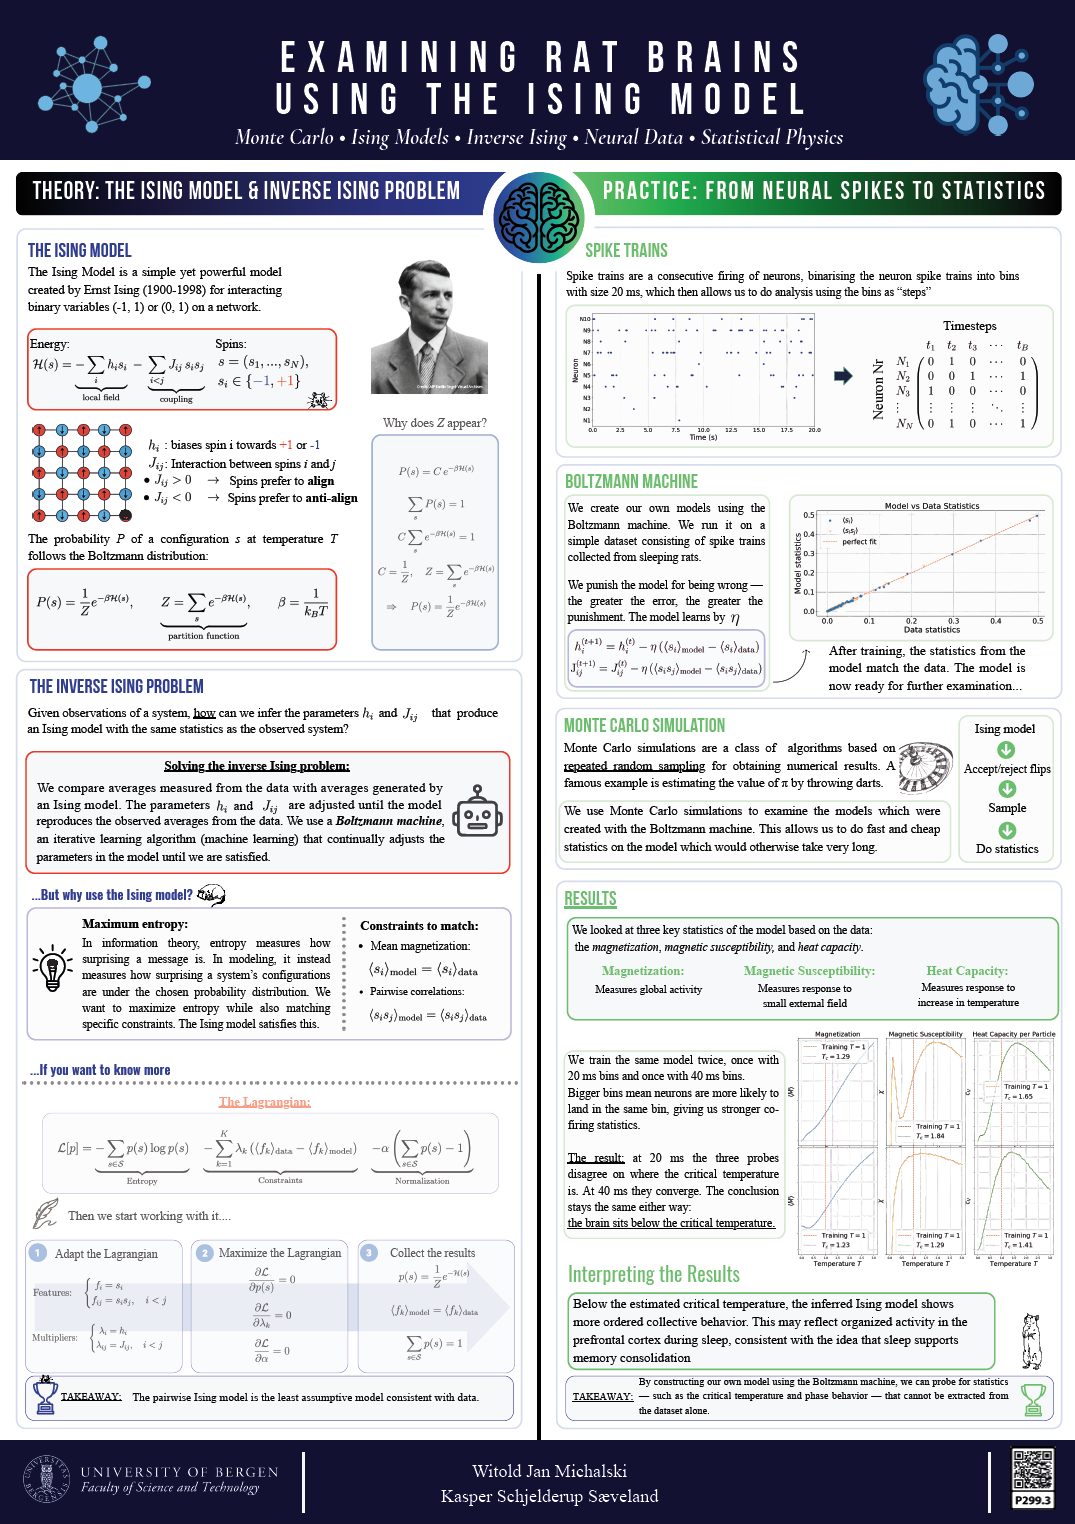
Examining rat brains using the ising model Posted on21/03/202616/05/2026Authorfemjs1 Comment Poster number: P299.3 Authors: Witold Jan Michalski & Kasper Schjelderup Sæveland PHYS299 - Spring 2026 Download as PDF
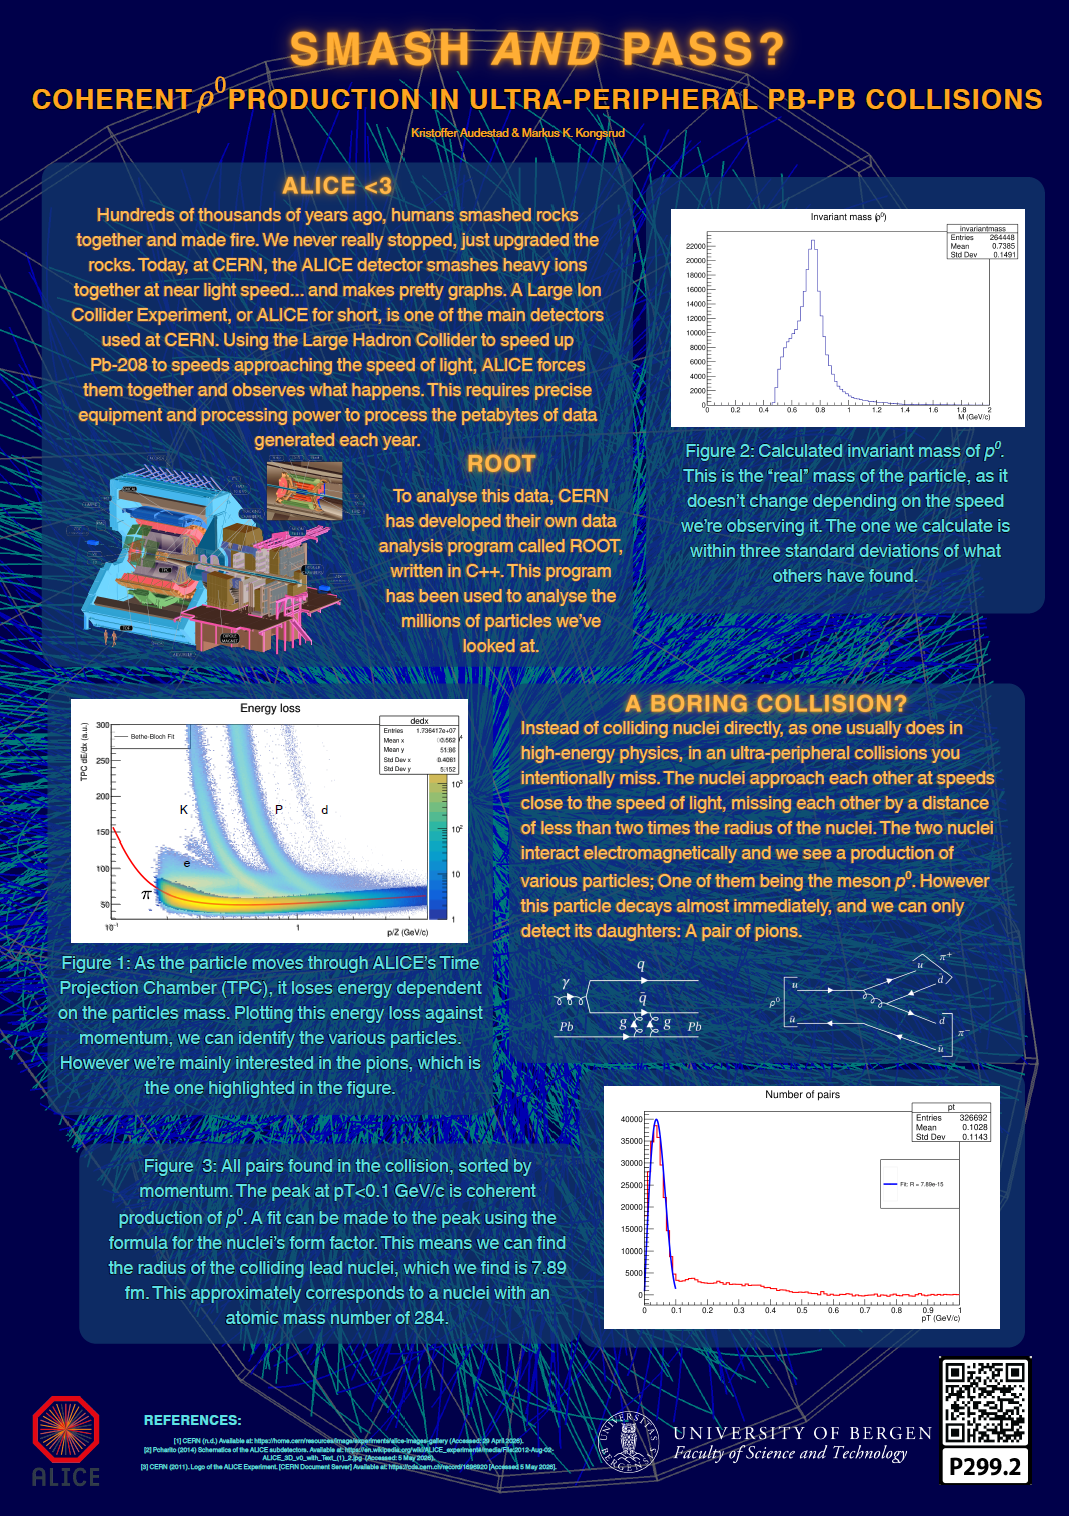
SMASH AND PASS? Posted on21/03/202616/05/2026Authorfemjs2 Comments Poster number: P299.2 Authors: Kristoffer Audestad & Markus K. Kongsrud PHYS299 - Spring 2026 Download as PDF
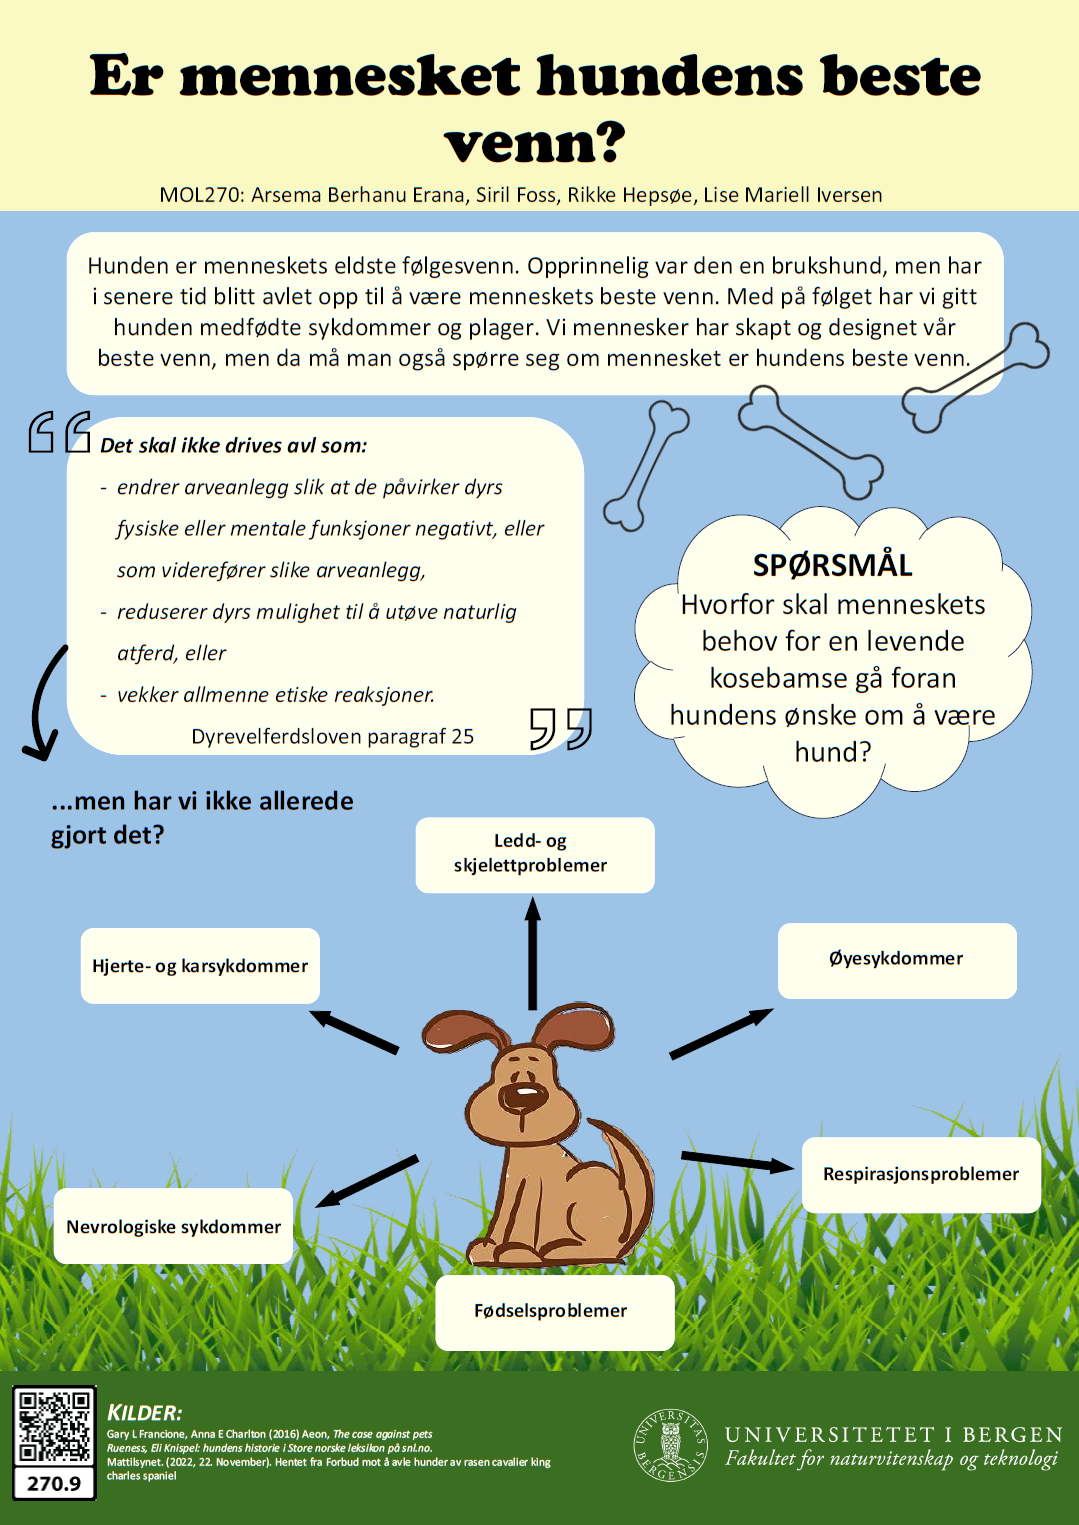
Er mennesket hundens beste venn? Posted on20/03/202616/05/2026Authorfemjs1 Comment Poster number: 270.9 Authors: Arsema Berhanu Erana, Siril Foss, Rikke Hepsøe & Lise Mariell Iversen MOL270 - Spring 2026 Download as PDF
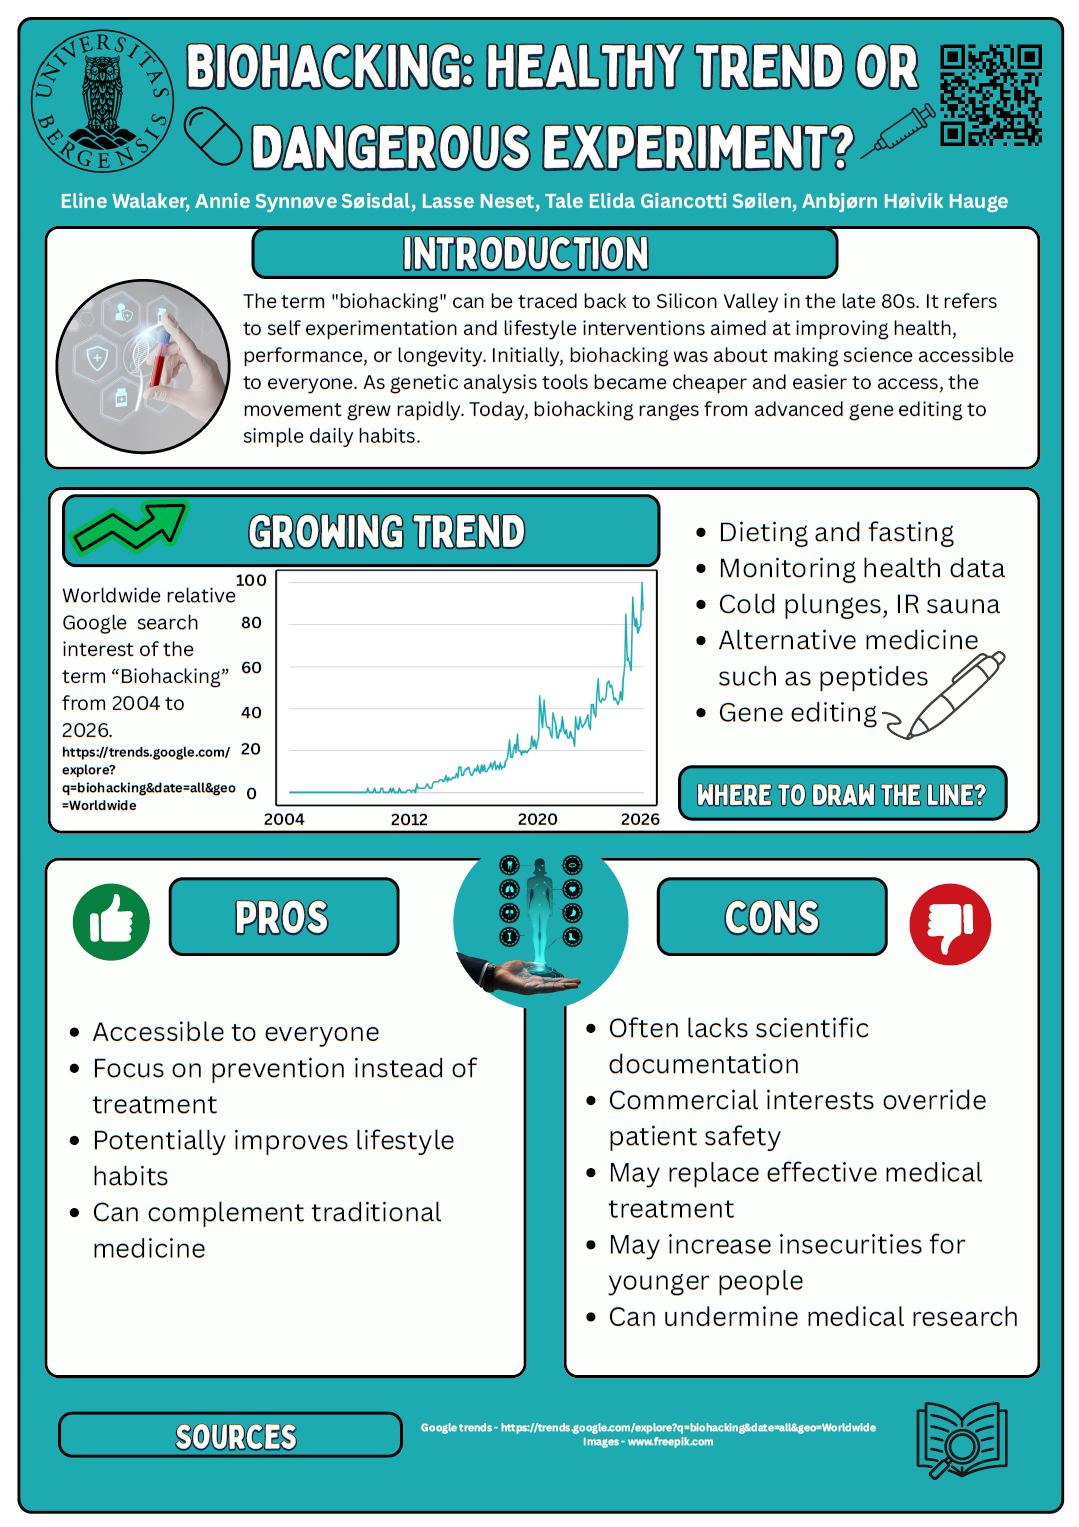
Biohacking: healthy trend or dangerous experiment Posted on20/03/202616/05/2026AuthorfemjsLeave a comment Poster number: 270.8 Authors: Eline Walaker, Annie Synnøve Søisdal, Lasse Neset, Tale Elida Giancotti Søilen & Anbjørn Høivik Hauge MOL270 - Spring 2026 Download as PDF
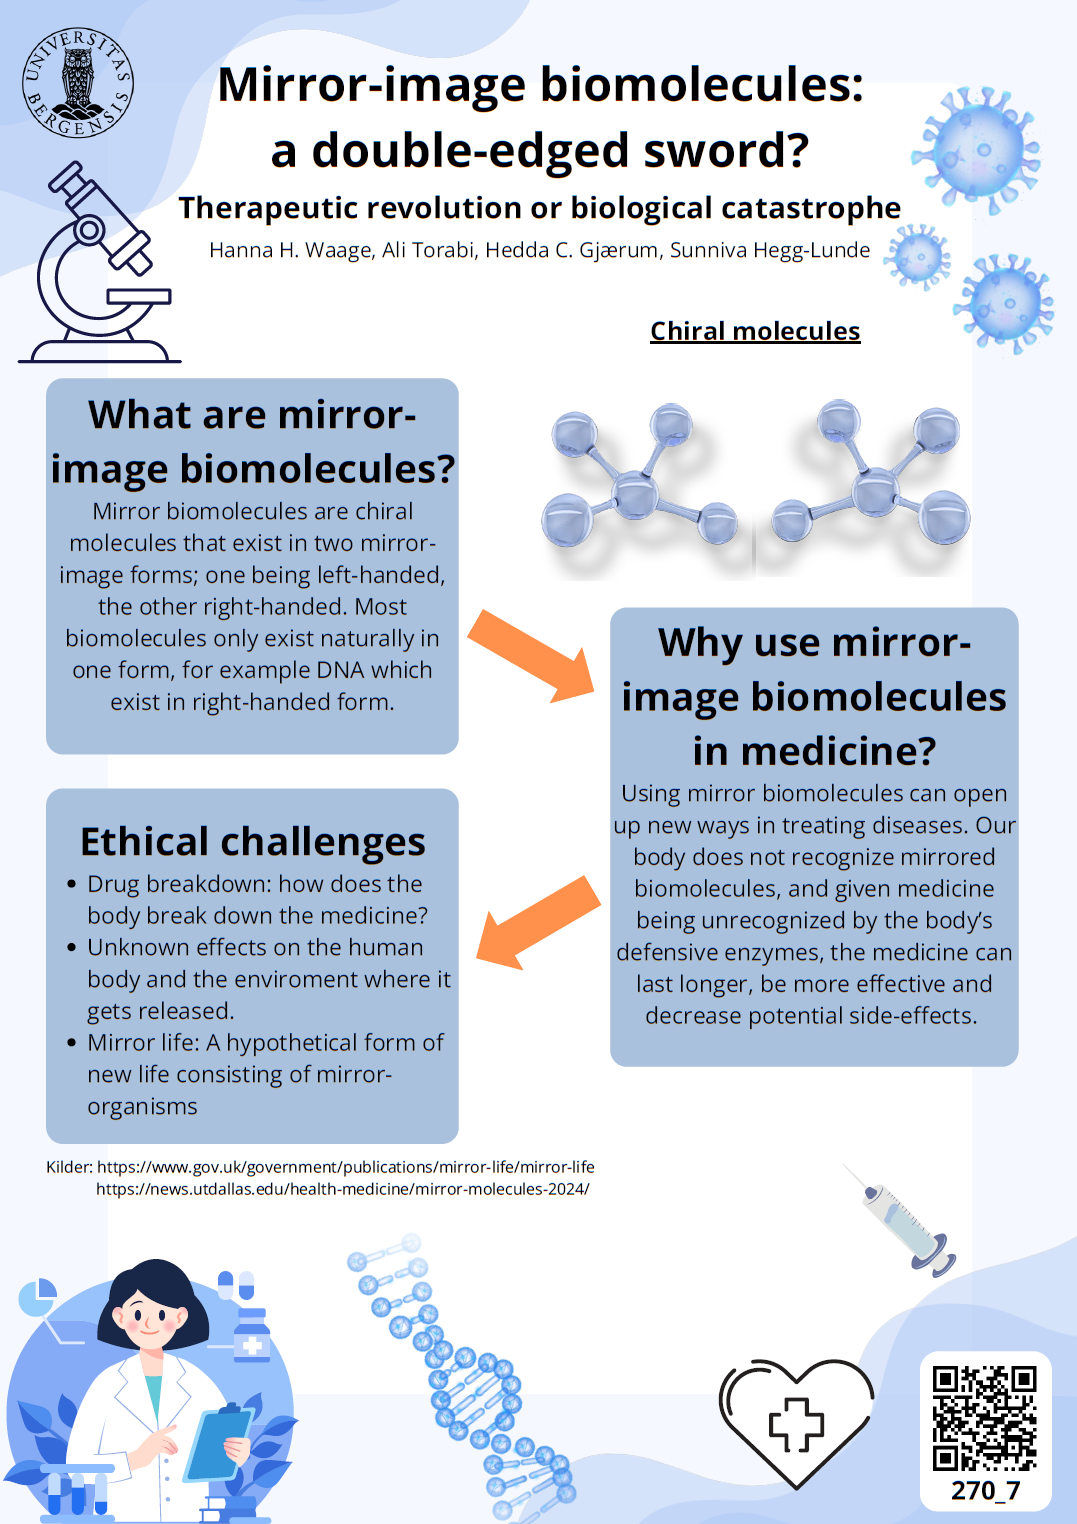
Mirror-image biomolecules: a double-edged sword? Therapeutic revolution or biological catastrophe Posted on20/03/202616/05/2026AuthorfemjsLeave a comment Poster number: 270.7 Authors: Hanna H. Waage, Ali Torabi, Hedda C. Gjærum & Sunniva Hegg-Lunde MOL270 - Spring 2026 Download as PDF
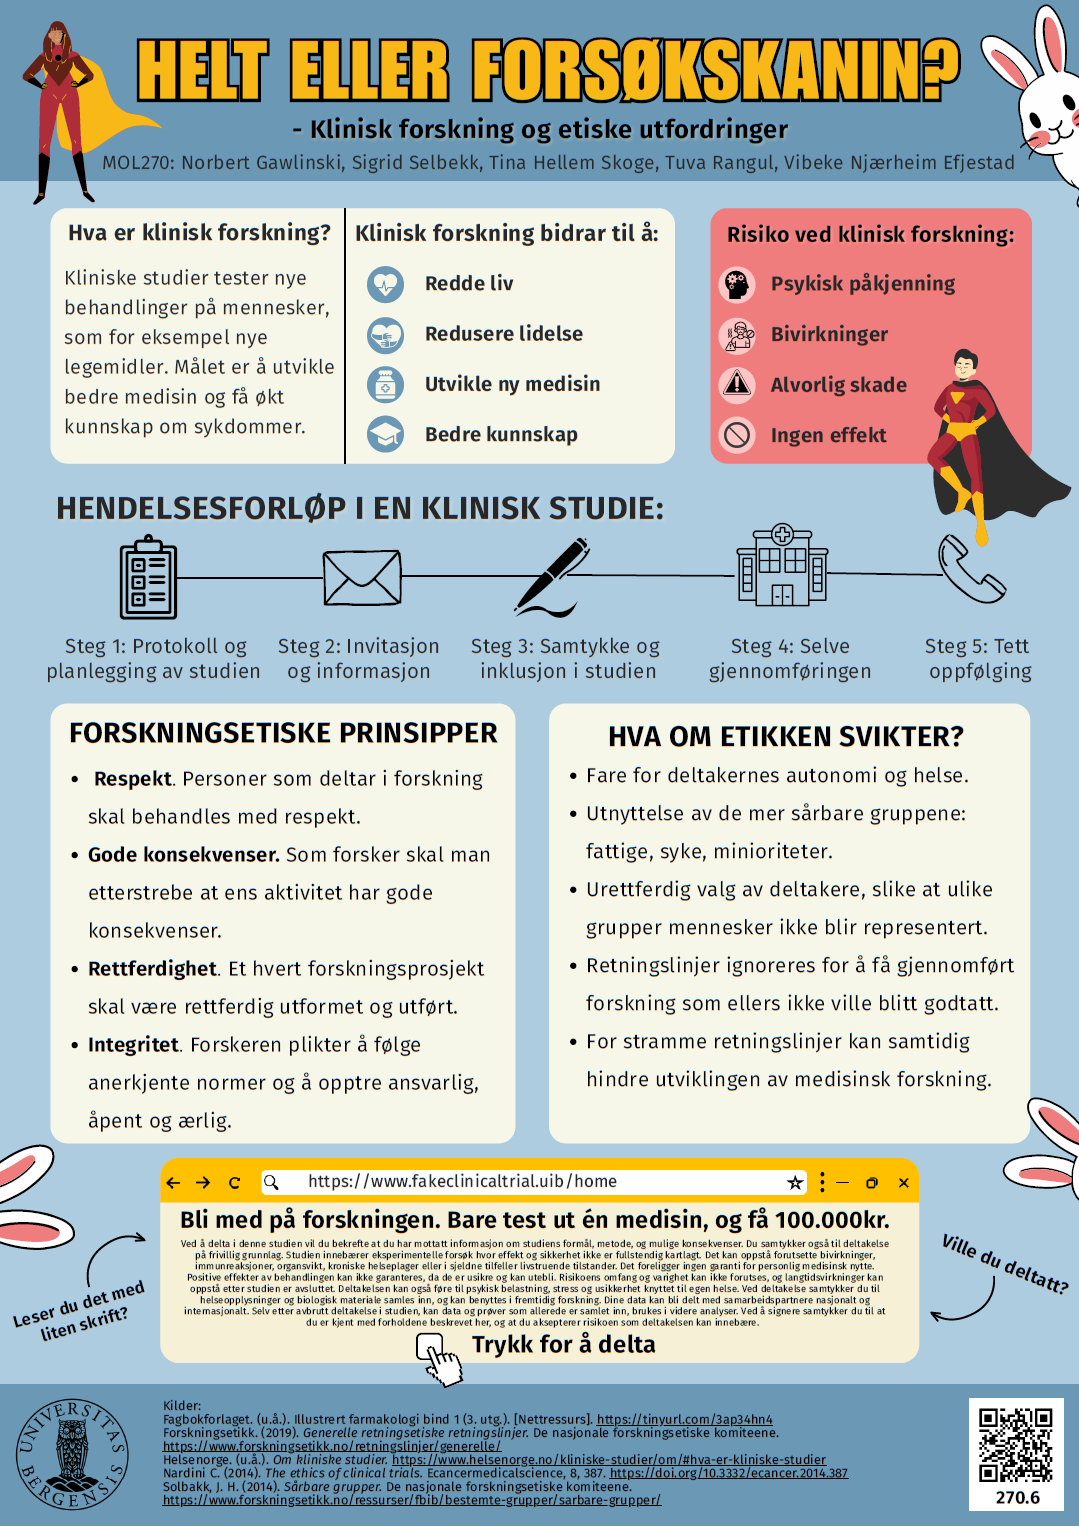
Helt eller forsøkskanin? Klinisk forskning og etiskee utfordringer Posted on20/03/202616/05/2026AuthorfemjsLeave a comment Poster number: 270.6 Authors: Norbert Gawlinski, Sigrid Selbekk, Tina Hellem Skoge, Tuva Rangul & Vibeke Njærheim Efjestad MOL270 - Spring 2026 Download as PDF
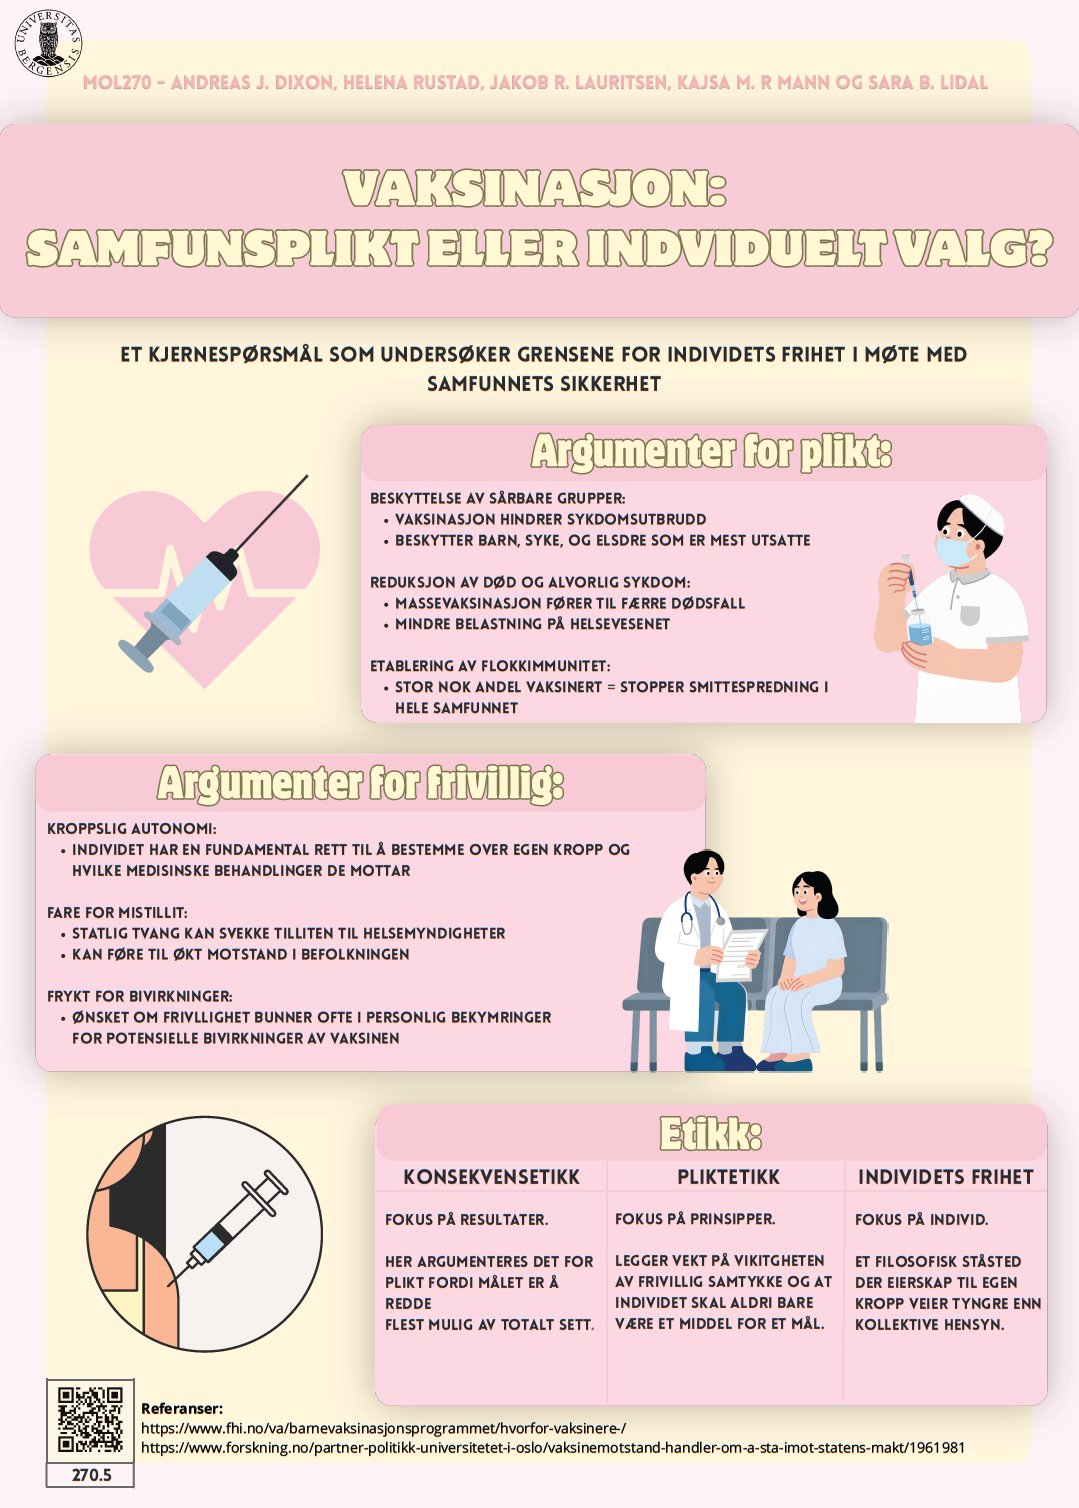
VAKSINASJON: SAMFUNSPLIKT ELLER INDVIDUELT VALG? Posted on20/03/202616/05/2026AuthorfemjsLeave a comment Poster number: 270.5 Authors: Andreas J. Dixon, Helena Rustad, Jakob R. Lauritsen, Kajsa M. R Mann & Sara B. Lidal MOL270 - Spring 2026 Download as PDF
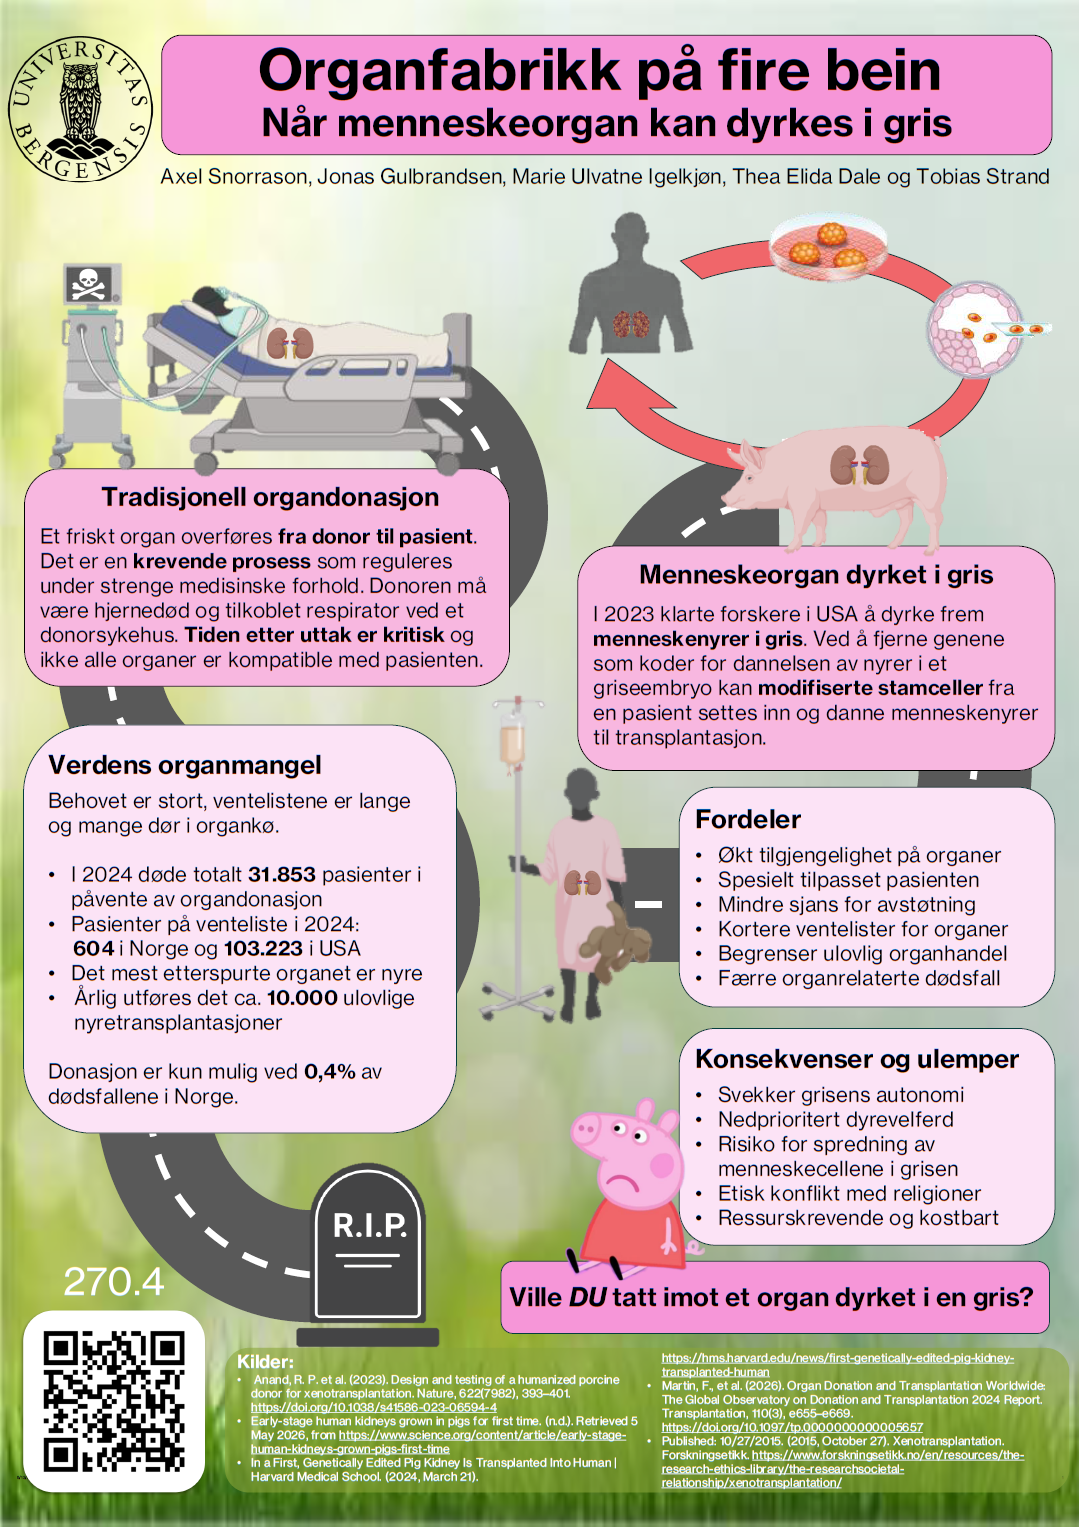
Organfabrikk på fire bein – Når menneskeorgan kan dyrkes i gris Posted on20/03/202616/05/2026AuthorfemjsLeave a comment Poster number: 270.4 Authors: Axel Snorrason, Jonas Gulbrandsen, Marie UlvatneIgelkjøn, Thea Elida Dale & Tobias Strand MOL270 - Spring 2026 Download as PDF